 REUTERS/Sheng LiHuang Lianfei, a worker at a metal craft workshop, stands on a ladder as he drills to construct a model robot based on a character from the cartoon “Transformers”


If you’re one of those people who don’t believe the Chinese government’s economic growth statistics, you’re not alone, and you haven’t been for some time.
That is perhaps why global consulting firm The Conference Board decided to use other metrics to measure growth in China. Those metrics make growth look much weaker than the government states.
The difference is so dramatic that Australian investment bank Macquarie put them in chart form in a recent report.
But before you take a look at the charts, here’s why The Conference Board decided to change their metrics:
CB has now adopted estimates by Professor Wu and the late Professor Maddison. What is the difference between the official and Wu-Maddison estimates? Over the last decade, China has been gradually moving from the Soviet system of collecting information as an output model (measuring production by sectors with information flowing from local officials up the chain) and towards the internationally recognized system of national accounts (SNA), which relies not on internal reporting but rather on sophisticated statistical surveys of consumer spending and investment. Whilst China’s systems have been gradually changing, the transition is far from complete and China continues to operate on a version of output system.
The Soviet system, called the Material Product System, measures an economy based on output — how many tons of steel it is producing, how much grain it is collecting. You get the picture.
Wu and Madison use something that looks like the System of National Accounts.
Back in 1998, when Asia was going through a massive currency crisis, Wu and Maddison called China out for its industrial-production growth number. The country said IP grew 0.3%. The professors argued that it actually contracted -0.1%.
You can read about all the drama that unfolded in “Understanding China’s Economic Indicators: Translating the Data Into Investment Opportunities,” a book by Bloomberg economist Tom Orlick.
Macquarie extrapolated a few key points in the differences between CB’s numbers and the official numbers.
- If CB is right, China’s sectors are way more volatile than we thought. For example, the country has reported basically flat retail numbers every month for about two years.
- The CB numbers are more in line with an index used by Chinese Premier Li Keqiang, which famously includes electricity use.
- If CB’s numbers are right, the question isn’t whether or not China is going to have a hard landing; it’s whether or not the hard landing has happened already.
- If CB’s numbers are right, then stimulus measures and investment won’t do much for an economy that’s too far gone.
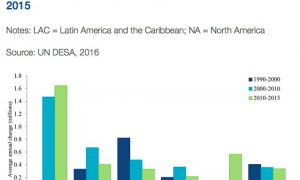
And now for the charts.