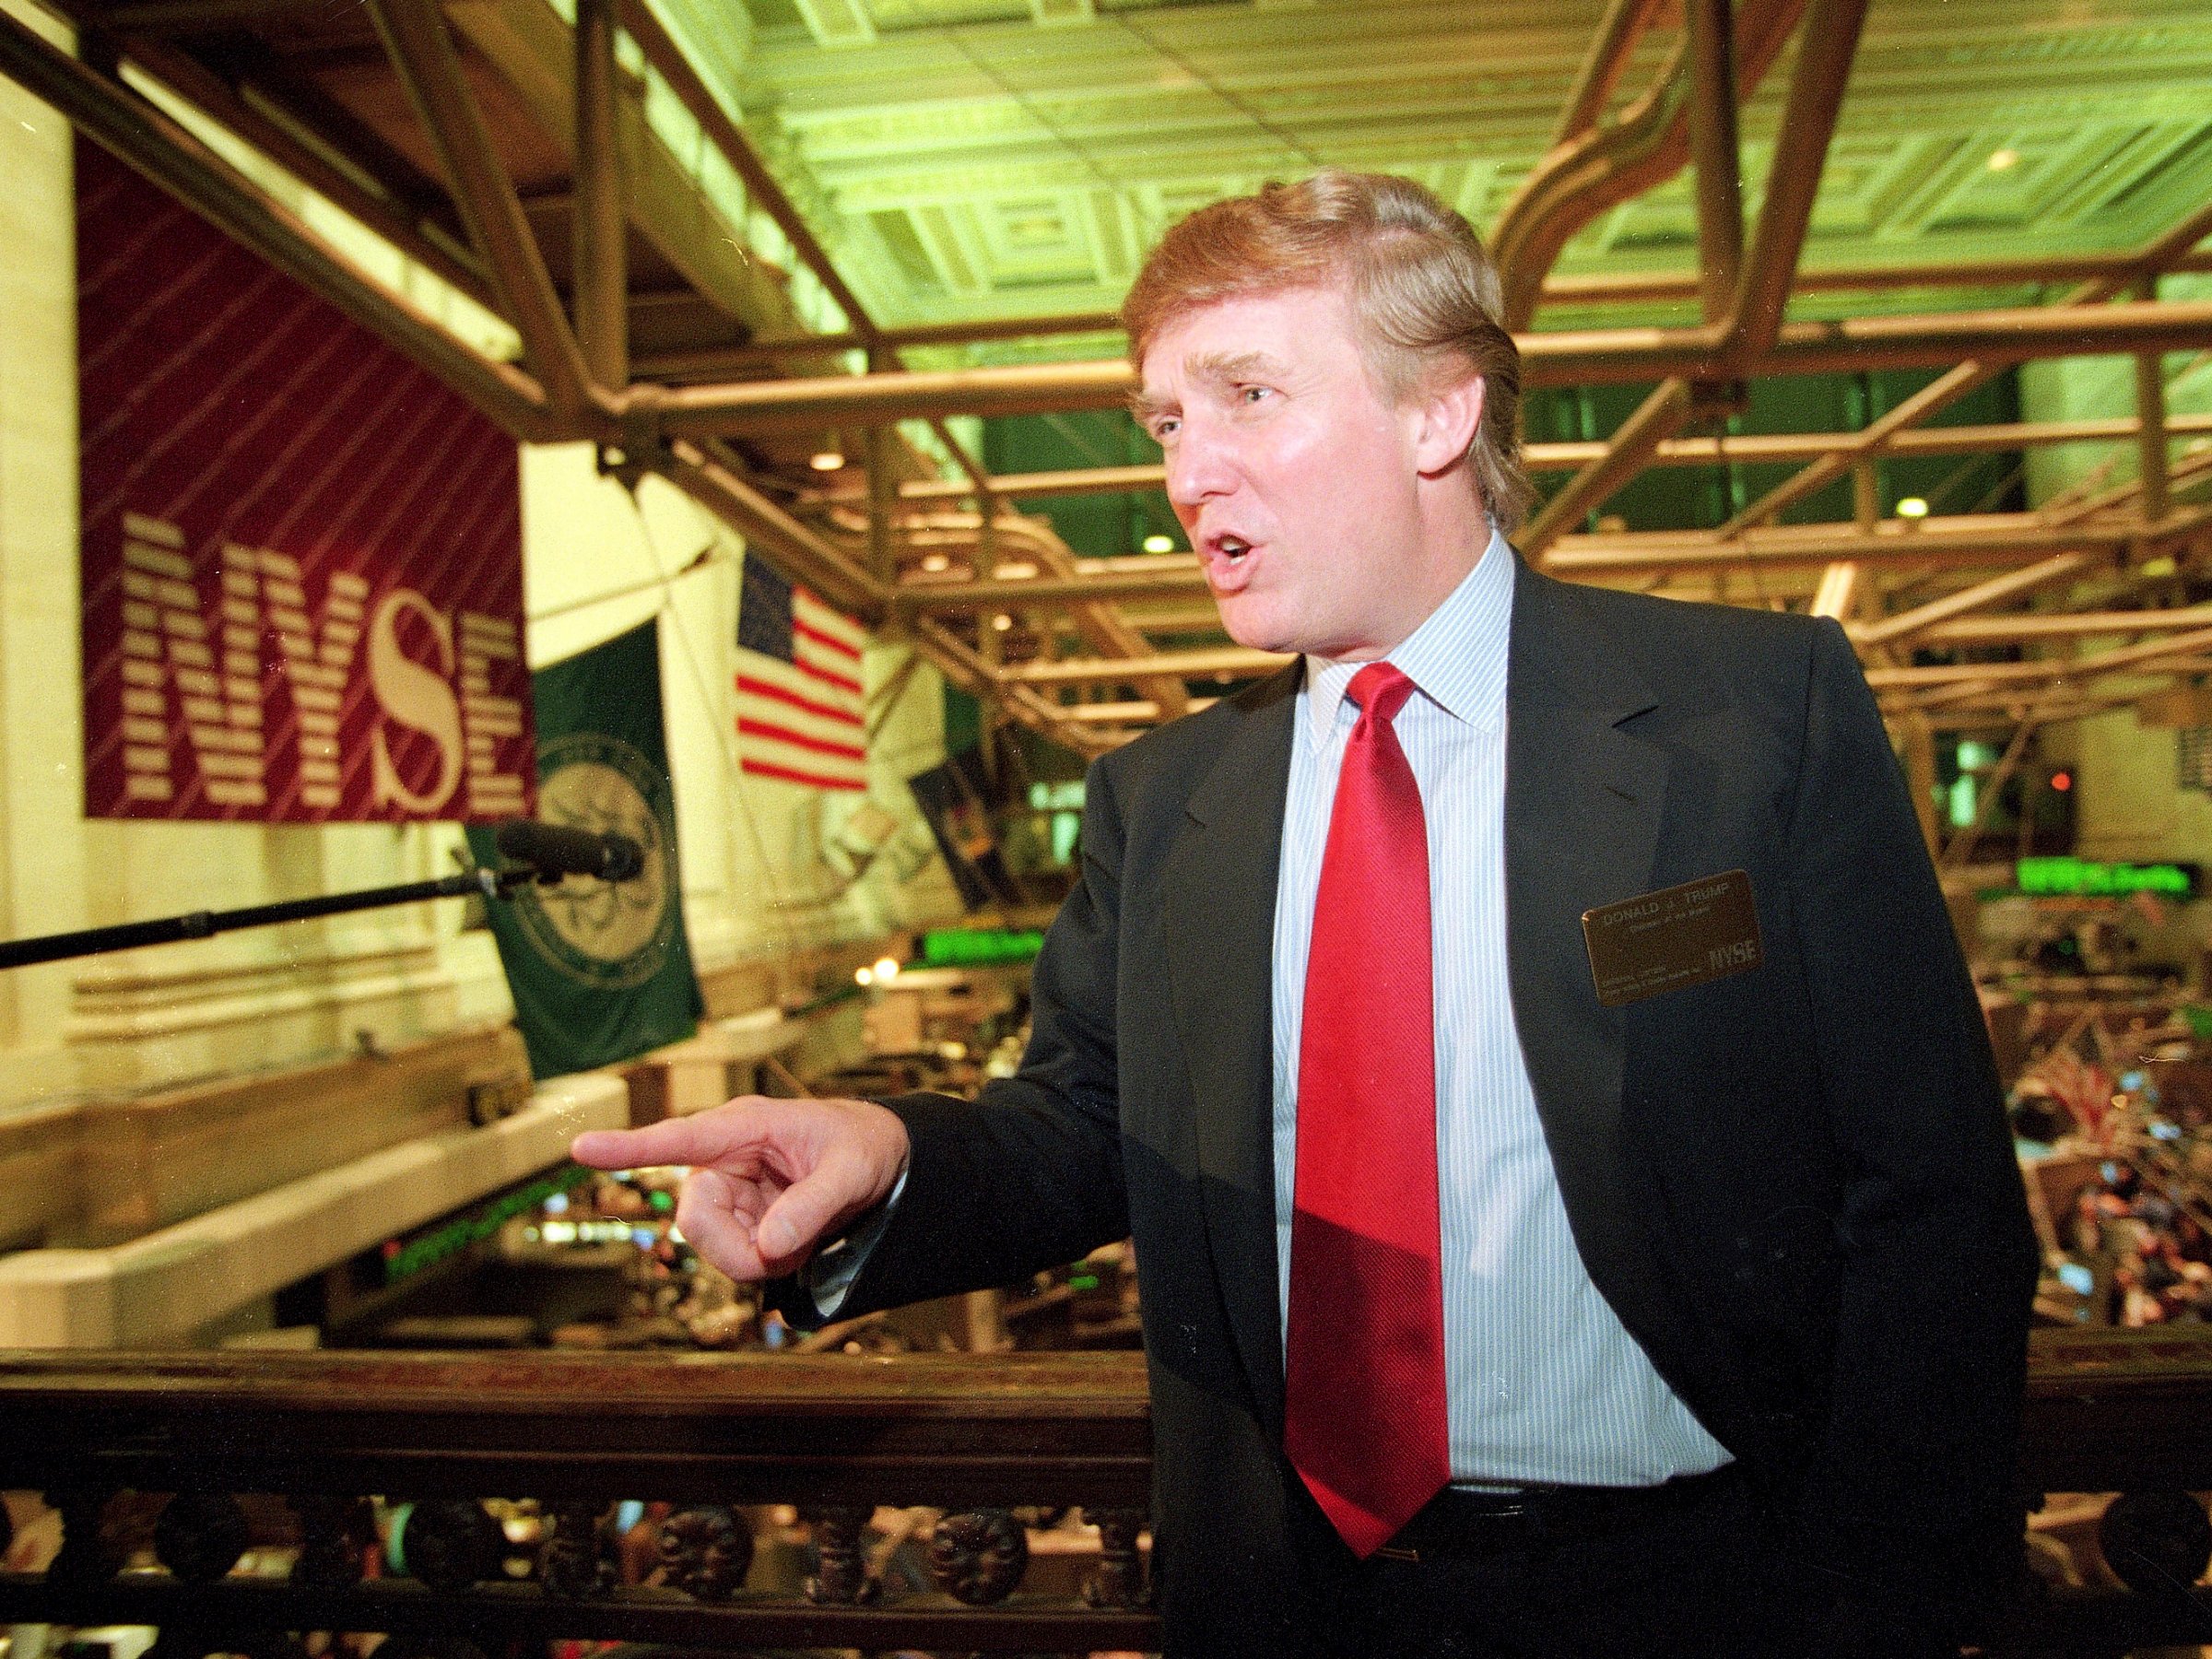
 Donald Trump has repeatedly taken credit for new record highs in the S&P 500. But are his claims warranted?AP/Kathy Willens
It’s a routine that has played out in 2017 as the S&P 500 has stretched well into the ninth year of a bull market that has brought it back to unprecedented highs.
And Trump was back at it again on Wednesday morning, with a series of tweets:
Stock Market has increased by 5.2 Trillion dollars since the election on November 8th, a 25% increase. Lowest unemployment in 16 years and..
— Donald J. Trump (@realDonaldTrump) October 11, 2017
…if Congress gives us the massive tax cuts (and reform) I am asking for, those numbers will grow by leaps and bounds. #MAGA
— Donald J. Trump (@realDonaldTrump) October 11, 2017
It would be really nice if the Fake News Media would report the virtually unprecedented Stock Market growth since the election.Need tax cuts
— Donald J. Trump (@realDonaldTrump) October 11, 2017
So is Trump right?
Not most of the time. While there have been moments this year during which the so-called Trump trade — or the promise of business-friendly policies — has been responsible for the gains, there have also been long stretches when other factors were driving returns.
To best assess Trump’s fluctuating influence on stocks, we’ve looked at the S&P 500 on a periodic basis. After all, each timeframe we’ve selected has its own distinct bullish story, and put together they show how the stock market benchmark has gone from one high to the next — each time being pushed by a different component.
Methodology
At the beginning of each section is a chart showing the performance of an index of stocks tracking highly taxed companies, relative to the S&P 500. The measure is intended to serve as a proxy for the effect of Trump’s proposed policies on the benchmark, with the thinking being that a lowering of the corporate tax rate has long been seen as the campaign promise most likely to be passed.
If the high-tax index is outperforming, that implies a high degree of overall confidence in the Trump trade and therefore outsized influence being exerted on the S&P 500. If the gauge is underperforming (in negative territory), that implied a low degree of confidence and minimal influence.
And bear in mind that if the line veers into negative territory (which — spoiler alert — it does), that isn’t reflective of the broader stock market — it’s just the most actionable part of the Trump trade. The S&P 500 as a standalone entity has repeatedly hit new record highs all year long.
In the end, hopefully, we’ll have given you enough information to conclude for yourself whether Trump has, in fact, been as indispensable to the stock rally as he claims to be.