On Sunday, Jalopnik posted a guide on how to understand NASCAR and the Daytona 500 under the sanctioning body’s new, complicated rules. The views on that post shot up and down in an almost unprecedented way during the race, plotting an astonishing graph of exactly when and how confused people were.
Just a few years after introducing a completely new system for deciding its championship titles, NASCAR decided to give the format for its weekly races a total overhaul for the 2017 race season. That overhaul consisted of in-race stages with points awarded at the end of each, a new race flag, a complicated new points system and huge restrictions on repairs to damaged race cars.
Advertisement
Advertisement
NASCAR implemented those rules across all three of its national racing series: the Monster Energy NASCAR Cup Series, the Xfinity Series and the Camping World Truck Series. And the rules are, admittedly, a headache to understand. They’re too complicated for even the avid NASCAR fan, and we thought that to be an absolute detriment to the audience’s ability to understand the sport.
That’s why we published the rules guide on Jalopnik. But we certainly weren’t expecting that guide to send as much of a message to us as it did.
In order to track our view counts and average time spent on a webpage across the entire Gizmodo Media Group network, we—like a great many websites—use the analytics service Chartbeat. Briefly, Chartbeat shows which posts are doing well, where they’re getting traffic from and how much time people are taking out of their days to read and/or comment on these posts.
Sponsored
But Chartbeat during the Daytona 500 on Sunday was incredibly unusual, with repeated upward spikes from Google searches during the race itself at different intervals. Even Jalopnik Editor-in-Chief Patrick George said he’d never seen anything like it on this site—not that many spikes, and not from search.
It was so wild, we’re going to show all of you.
The Analytics
When we first published the guide, it was enough to give our little Chartbeat traffic line a lift. That just means you did something right with a post. Our good friends at Deadspin then shared the guide, and the line kept steadily climbing.
Advertisement
Advertisement
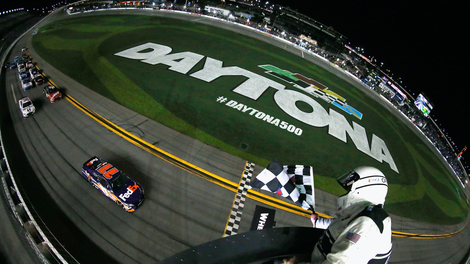
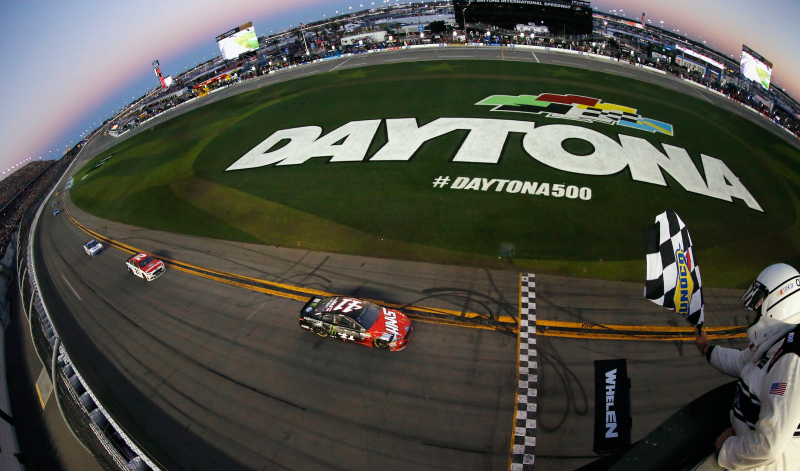
But then the first of three “stages” in the race ended. Traffic analytics for the entire website shot up as soon as the weird, new green-and-white checkered flag came out.
Let’s break this Chartbeat image down. The gray line in the background of that chart marks traffic from this day last week, and traffic that day was far higher than an average Sunday due to a couple of things: a Foxtrot Alpha post and a post on ghost tracks, which published that Saturday and carried traffic into Sunday. It tapered off at nearly 145,000 page views.
Traffic spiked again the Sunday marked by the gray line when Patrick published a story about some German Typhoons intercepting a commercial jet on Foxtrot Alpha that did more than 300,000 views. That’s nearly 75 percent of the traffic goals for the entire weekend, in two posts. In other words, traffic was high last weekend.
Advertisement
So, as you can see, that gray line was going to be hard to beat. Some weekends are good, some are not. Traffic was well below it before the NASCAR explainer, and then it slowly began creeping back toward the gray line marking last week’s traffic when the NASCAR guide posted.
Then the first stage ended. The colored bar for that Sunday shot up, and with that bit of context you just read, you now understand just how significant the spike in traffic was.
What’s also critical is where that traffic was coming from. While you can see that our usual traffic comes pretty evenly from the entire mix of sources that Chartbeat lists, with internal being the highest usually, look at how thick the green bar is and how much it grows by.
Advertisement
Advertisement
That’s traffic via internet searches, and the top post on a Google News search for “NASCAR rules,” “Daytona 500 rules” and “NASCAR stages” was the rules explainer we published. In a frenzy to understand the new rules, people were clicking the first thing that came up. And in general, at Jalopnik, search isn’t a big part of our daily traffic sources. It’s there, but it’s slim, especially compared to our friends at Lifehacker, for example, who draw a lot of traffic from search because people are always Googling for the useful tips they cover.
You can also see in the Chartbeat screenshot that our new and returning visitors were incredibly high, while loyal was dragging behind. We had a lot of NASCAR posts on the page that day, so that probably explains our loyal readers throwing their hands up for the day. Not everyone who reads Jalopnik is into NASCAR.
But we had twice the concurrents, or the amount of viewers on the website or a certain page at once, than the average weekend day. Most of those concurrents came from Google search.
The post topped our famed big board—the posts with the highest traffic in the network—in intervals for several hours before and during the Daytona 500, sometimes having nearly 4,000 people on the page at once. Racing posts almost never do that. That’s a lot of confused people.
Advertisement
As the second stage began, views on the guide began to trickle off. It kept a high retaining rate, though. Retaining rates are how long the average reader spends on a page, and the guide ranged from a minute and 11 seconds at traffic spikes to well over two minutes at other points during the day and race. People usually spend 30 seconds on some random thing they read on the internet.
Then, the second stage ended. That strange new green-and-white checkered flag came back out. Traffic via internet searches shot back up, just like it did the first time. Take a good look at the gray line behind those analytics, which shows the incredibly high traffic we had the Sunday before.
As soon as the third stage began, that peak dropped even faster than the first one had. It was an astonishing thing to follow along live, because the analytics showed exactly when and how confused everyone was at different points in the race. Even with nearly 3,500 people on the page at once, readers were spending a minute and 13 seconds on the post on average.
Advertisement
Advertisement
And, because most of those people came from internet searches, they weren’t spending time arguing in the comments or anything like that. They were using all of this time to read what had been written about the new rules.
Both the spikes, and the traffic from search, were super unusual for us. You can tell by how smooth that gray traffic line is from last week.
Because so few people who came to the page from internet searches had Kinja accounts that allowed them to comment on the post, it only got 55 comments—some from the author, me—across its nearly 50,000 views.
Advertisement
Traffic to this post, from our front page on Jalopnik, was dead.
The point is, people weren’t spending several minutes on here to comment on the new NASCAR rules. They were reading the post. In a time when people really only want to watch little Facebook videos with text across them, people were spending an average of nearly two minutes reading a post from a Google search.
What Does It All Mean?
Well, obviously, people were confused.
Advertisement
Advertisement
You can see exactly when the confusion came and how widespread it was, which was an absolutely foreign experience for us. These are analytics for an entire website, being so significantly driven up and down as a result of one post. That doesn’t happen every day.
But these analytics could show another, more positive, picture for NASCAR as well. People invested an average of nearly two minutes to read about the rules at some points before and during the race, rather than just changing the channel and throwing the remote across the room.
That means people clicked the top post they could find on Google, or wherever the post shook out on other search engines, and actually invested time in trying to understand what was happening in NASCAR. Perhaps those people only cared to use the rules information for the Daytona 500, or perhaps they wanted to understand NASCAR going forward. That, the analytics can’t tell you.
What it does tell you is that for the people who found our guide via an internet search, NASCAR’s complicated new rules were something they wanted to learn. They didn’t get completely discouraged by seeing all of this intricate stuff play out on television, and they invested time into understanding the sport.
Advertisement
It’s also worth noting that a ton of people watch the Daytona 500. Nearly 12 million this year, in fact, although that’s down quite a bit from a decade ago. It remains one the most-watched races on the NASCAR calendar, and was a massive stage to showcase the new rules.
Whether all of this means NASCAR’s new rules have a promising future, we’ll just have to see. But if this is any hint, maybe people are more willing to adapt than we originally thought.