The NHTSA released the alarming traffic fatality figures for the first nine months of 2015, and it wasn’t good—traffic fatalities increased over 2014’s figures by 9.3 percent. Why did it shoot up so fast?
The report released by the National Highway Traffic Safety Administration estimated that 26,000 people died in traffic related incidents in the first three quarters of 2015, which is up from 23,796 deaths in the same span of 2014. The first quarter of 2015 was the highest year-over-year increase since 2012, so what’s the deal?
Well, the NHTSA also concluded that American drivers tallied over 80 billion more miles collectively in the first nine months of 2015 over the previous year, suggesting that more activity due to an increase in car sales and a decrease in gas prices lead to an increase in traffic deaths, despite advances in safety technologies. Americans are driving more, and subsequently crashing more.
Advertisement
http://jalopnik.com/americans-boug…
The number of deaths per every million miles, which is the tally measured by the NHTSA, increased from 1.05 deaths per million miles in 2014 (the lowest ever) to 1.10 deaths per million miles in 2015. While that is still one of the lowest ratios ever recorded, it showed a 3-to-1 disparity between the increase in traffic deaths and the increase in miles driven, as pointed out by Autoblog. They also pointed out that, if the increased rate continues into the final quarter of 2015, it will be the largest year-to-year spike since 1946.
Sponsored
The regions with the sharpest increases in fatalities were the southeast with a 16 percent jump, and the northwest with a 20 percent jump over the first nine months of the year.
The government looks to focus on pushing advocacy against drunk driving and reminding motorists to wear seat belts, with summits to be held with law enforcement agencies, local governments, and companies like Uber and Lyft to try and minimize the fatality rate going forward.
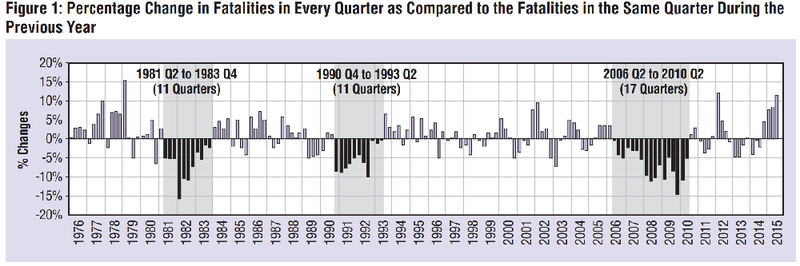
Overall our vehicles and our roadways have become generally safer and seen a steady decrease in fatalities since 2000, with the longest span of year-over-year decreases running from 2006 to 2010. The first three quarters of 2014 showed a promising decrease before jumping back up in the final quarter, and continuing to grow into 2015.
You can check out the NHTSA’s report here, which includes charts and graphs displaying their figures ranging all the way back to 1976.
Contact the author at justin@jalopnik.com or @WestbrookTweets.